Online Cartogram Tool

I have always found good visualization of data very important. A nice way to represent data related to maps is to use cartograms. Where a normal map allows you to color each country/state with a color representing your data, a cartogram allows you to convey much more information. In a cartogram, just as for a map, you also color each region to represent data, but on top of that, you inflate/deflate the size of each region to represent some more data.

In the example on the bottom of this post, each US state is colored green/red depending on its population growth. The states are inflated to represent the total population living in the state (I used recent data from Wikipedia). The other tab has the same example but for the European countries.

With the tool at the bottom of this post you can create your own maps and cartograms. Choose a color for each state/country and pick the size to which each country needs to be rescaled, click the Create Map button and your cartogram will be made.

Usually it is best to choose an intensive property to determine the color. An intensive property is data that does not depend on the size. Population growth is an example of such data. Population growth can be 1% no matter whether we are talking about a country with a large population or a small country.
On the other hand, the size is best determined by an extensive property, a property that does depend on the size. Examples are population, area, gdp, debt, ... The tool comes with some presets for the extensive properties. If you choose area as extensive variable the size of each country will be its actual area (and you will thus get a normal map that is not inflated).

To represent data as a color, I find it useful to divide the data into bins. Each bins then gets a discrete color. The color scheme used in the example pictures below are: from 00ff00 for full green, over 77ff77, bbffbb, to ddffdd for transparent/white green. For red the same idea applies: from ff0000, over ff7777, ffbbbb, to ffdddd.

If you are interested in more elaborate cartograms (e.g. the entire world), you are always welcome to contact me (leave a comment and I will get back to you). If you can provide me with an xml file in this format. The size is the inflation/deflation factor, the color tag encodes the rgba-color as a decimal. The rowname should correspond to the shapefile data from the map. I got all the shapefile map data on the wonderful website of Natural Earth.

Happy mapping!

Alabama Louisiana Ohio
Alaska Maine Oklahoma
Arizona Maryland Oregon
Arkansas Massachusetts Pennsylvania
California Michigan Rhode Island
Colorado Minnesota South Carolina
Connecticut Mississippi South Dakota
Delaware Missouri Tennessee
Florida Montana Texas
Georgia Nebraska Utah
Hawaii Nevada Vermont
Idaho New Hampshire Virginia
Illinois New Jersey Washington
Indiana New Mexico Washington, DC
Iowa New York West Virginia
Kansas North Carolina Wisconsin
Kentucky North Dakota Wyoming

Size presets:
Austria Germany Netherlands
Belgium Greece Poland
Bulgaria Hungary Portugal
Cyprus Ireland Romania
Czech Republic Italy Slovakia
Denmark Latvia Slovenia
Estonia Lithuania Spain
Finland Luxembourg Sweden
France Malta United Kingdom

Size presets:

Buy-And-Hold Trading Strategy

Sometimes you hear that a buy-and-hold investment strategy is superior to market timing.

I want to test this hypothesis. Let us consider the following simplified situation where we can invest in either the S&P500 or in a money market account with a fixed yearly return of 3%. The goal is to find a market timing strategy that would yield a higher return than a buy-and-hold of the S&P500. Moreover, I assumed that the market timing decision can only be based on the evolution of the S&P500 up to that point in time. I am thus not using other data besides the S&P500 to time the market.

In the graph below you see the input data in red (historic S&P500 data over 20y). Derived from this data, in green are two moving averages averages. In blue is the S&P500 volatility, with in black and and yellow moving averages on the volatility.

Portfolio Trading Strategy Inputs (S&P500 - 20 years)
Input for the portfolio trading strategy

Some market timing strategies based on this data come to mind:
Moving average crossovers consider two moving averages with different periods. The moving average with the shorter period will follow the data more closely, and will also be less smooth. If the S&P500 is on a mostly upward trajectory the moving average with the shorter period will be higher in value than the other moving average. However, if there are some declines of the market, the shorter moving average will follow this decline more closely. As such it will drop below the moving average with the longer period. This crossover of moving averages is sometimes used as an indicator to sell. The other type of crossover where they cross the other way signals a buying opportunity.

The strategy that I will consider further in this post, is another type of strategy based on the volatility. During periods of market stress the volatility shoots up. To determine whether the volatility is low or high, we compare it to a moving average of the volatility. Thus, on the above graph we consider the blue and black lines. If the blue line is above the trailing black then we consider it to be a period of market stress and move our investments to the safer money market account.
This strategy is represented in the chart below. The red indicates the amount held in the market, while the black line is the money held in the money market account. The total return is given in light blue. You can thus see that this particular strategy was not that profitable: the return of the buy-and-hold is much higher. That is illustrated in the performance chart below where the yearly internal rate of return is computed for both strategies.

Detail of strategy
Detail of portfolio trading strategy
Performance of Strategy
Trading strategy performance


Monte Carlo test of the strategy

The real test of an investment strategy comes not from testing it against a specific period. To test the strategy I generated 100 "possible" S&P500 scenarios and checked how our strategy performs. The scenarios are generated using a GARCH stochastic volatility model. The model was calibrated using the parameters from Table 7 in the paper Maximum Likelihood Estimation of Stochastic Volatility Models by Y. Ait-Sahalia and R. Kimmel.

Monte Carlo Input (based on S&P500)
Trading strategy monte carlo input

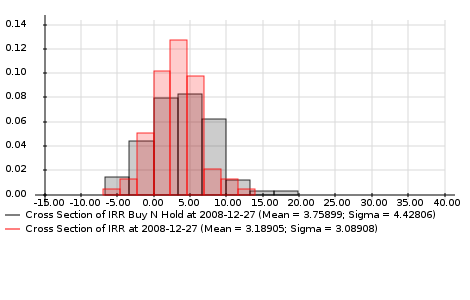
The final result is shown below. For each scenario we run our strategy and compare the internal rate of return of the strategy with the return we would have obtained with buy-and-hold. We find that the average return of our strategy over all scenarios is 3.19%, while the buy-and-hold strategy has an average return of 3.75%. However, the returns of our strategy are more consistent (lower standard deviation of returns): a buy-and-hold sometimes gives rise to very high returns, but also to more worse returns.

This conclusion is that I found for all the different (but similar) strategies that I have tested: a lower average return, but less risk (less extreme losses and gains).

Internal Rate of Return for all scenarios
Trading strategy excess internal interest rate

Article by ‘t Hooft (January 2008)

Counter - A theory of everything should only deal with certainties by Prof. G. 't Hooft

ACKNOWLEDGEMENT

Published in the Dutch language science magazine "Natuur Wetenschap & Techniek", issue January 2008 as part of a collection of articles from leading scientists describing a common idea in their field they disagree with. Translation below is by Korneel van den Broek with permission from Prof. G. 't Hooft and Natuur Wetenschap & Techniek.

ABSTRACT

An issue where I disagree with almost all of my colleagues, deals with the question what one may expect of a complete theory of all natural phenomena, the "Theory of Everything".

ARTICLE

Issues we mostly agree upon (apart for some details):

1) It is very unlikely that mankind will ever be able to formulate the exact universal laws of nature, although this just might nonetheless be possible. We believe this because combining the laws of quantum mechanics and gravity suggests that there is a 'smallest distance'. At even smaller scales, the concepts 'space' and 'distance' loose their meaning. This is similar to zooming in on a digital image: once one is able to distinguish the individual pixels, zooming in becomes useless and it doesn't make sense to attribute individual properties to one half or one quarter pixel. At that level there could exist a fundamental, universal equation of motion which determines with infinite precision what happens. From there, everything follows using induction and mathematics.

2) We cannot expect that one can describe with infinite precision all macroscopic phenomena with such a theory, let alone predict. We will still be forced to use approximation techniques with very limited precision. In practice, such a fundamental theory would therefore only have a limited impact.

Now the disagreement:

3) Will an equation of motion completely determine all events in the universe or, just as we are used to from quantum mechanics, will it only provide probabilities of what could possibly happen? This is what current theories do. For every experimental setup studying small particles such as atoms, quantum mechanics can only provide probability distributions.

According to current understanding, it is fundamentally unpredictable when a radioactive atom will decay. The theory only provides the probability per unit of time that it will decay (as such the theory is very precise once one deals with a macroscopic amount of material). For all practical purposes, this works so well that nobody complains anymore. If one would have a deterministic theory for atoms and molecules, it would not provide better predictions since for experiments dealing with millions of atoms one cannot know the initial state, so one would have to rely on statistical techniques anyway.

I am one of a few who claim that a complete theory should only deal with certainties. While I expect that nature contains so many moving cogwheels that it will remain impossible to capture them with infinite precision, the issue deals with the principles on which such theory should be based. If one knows for all the dynamical variables the exact initial state, the final state should be completely determined and not a probability distribution.

Most of my colleagues tell me, with varying amounts of tactfulness, that my ideas are outdated since the beginning of the last century, and that it is naive to try turn back time. Quantum mechanics is too beautiful to reject. They believe that nature, including the most fundamental laws to which any phenomena can be reduced, are fundamentally quantum mechanical. My suspicion is that not nature, but our understanding of nature is quantum mechanical. The laws we know only provide probabilities since we don't know the actual laws (yet?).

My colleagues confront me with theorems by John Bell and others, which purportedly show that my point of view is untenable. What those theorems do show instead is that their interpretation of my ideas is untenable. The 'reality' I talk about does not consist of atoms, electrons or other particles that have energy levels and rotate around their axes, but instead little cogwheels which are billions and billions of times smaller. Their collective behavior implies that one can use the quantum mechanical language for atoms and electrons. However, the behavior of atoms or electrons can never be considered completely independent from what happens at that much smaller scale. This could be an explanation for the odd phenomena we call 'quantum mechanics'.

The major difficulty of my point of view, which I indeed realize, is that I am unable to demonstrate the mathematical laws which would underlie this special situation.

Gerard 't Hooft
Professor Theoretical Physics
Utrecht