This example also relies on the component of the project that processes information. To demonstrate this, I constructed a fake portfolio containing a fund from each of the major Belgian banks:
| Price or amount | Buy date | Sell date | |
|---|---|---|---|
| CD 3.7% | 5000 EUR | January 1, 2007 | January 1, 2008 |
| ING L Invest Greater China P Acc | 5.0x | January 1, 2007 | December 1, 2007 |
| Dexia Bonds International C | 3.0x | January 1, 2007 | . |
| Fortis L Commodity World Classic | 50.0x | August 1, 2007 | . |
| CD 5.1% | 7000 EUR | January 1, 2008 | January 1, 2009 |
| KBC Renta Florinrenta Acc | 3.0x | February 1, 2008 | . |
This portfolio (including the data needed for the interest rates plot above) is defined in an xml control file. Taxes and fees on the individual assets and portfolio can be specified in this control file. Note that the control file also logs the exchange rate of the Hungarian forint versus the euro since the value of KBC Renta Florinrenta Acc is read off from the web by the webbot in HUF.
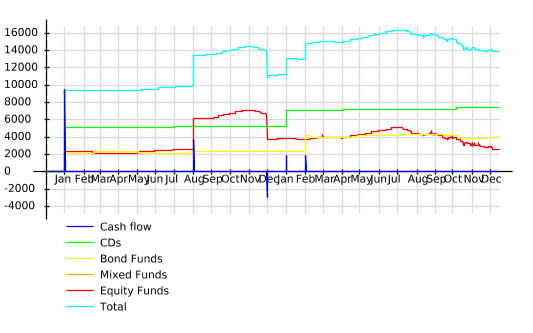
The evolution of the currently held assets which do not have a fixed interest can be followed on this chart. The total value of the portfolio from January 1, 2007 until December 15, 2008, is sketched below.

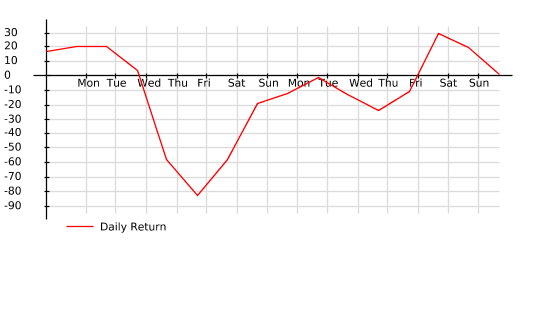
The daily return over the last two weeks until December 15, 2008, is sketched below.

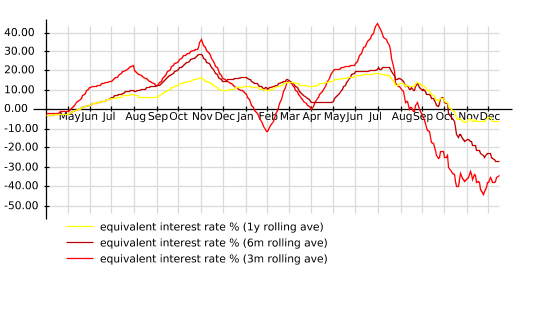
The chart below plots the yearly interest rate a hypothetical zero-coupon bond without fees or taxes would need to have, to obtain the same performance over a specified period. In the chart these periods are 3 months, 6 months and 1 year respectively.
